Literacy, Disability and Canadian Labour Force Participation

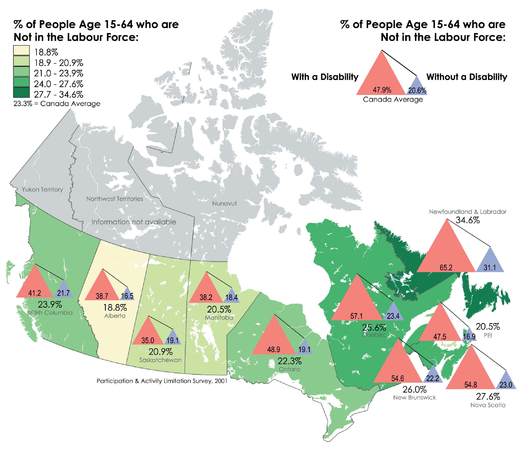
People with disabilities don’t get many opportunities to get jobs and keep them. When people with disabilities do get paying jobs, it is often precarious employment, meaning it lacks security, benefits and a living wage. As Map I shows, nearly half (47.9%) of people with disabilities (aged 15 Ð 64) are “not in the labour force.” The data to create the map was taken from the Participation and Activity Limitation Survey (2001). It shows that if you have a disability and live in Quebec, Newfoundland and Labrador, New Brunswick or Nova Scotia, you are less likely to have paid employment.
Why do people with disabilities leave or stay out of the labour force?
Greg’s experience tells part of the story. A resident of Toronto, he reports that he has had at least 10 (well-paying) jobs in the past five years. All his jobs were contract clerical positions. They were temporary in nature and offered no job security or benefits, and when employers made cuts, Greg was the first to go. After his last job ended, he made the decision to leave the workforce permanently. Greg was born with a spinal disorder and always uses a wheelchair.
Why did Greg decide to never return to work?
In his own words: “The main reason is that it took me six months to get back on ODSP [Ontario Disability Support Program] after I ran out of EI [Employment Insurance] when my last job ended. I had no work, no money, and no welfare for six months! I could not pay the rent and I almost lost my apartment. It was impossible to go back home (my parents’ house is not wheelchair accessible) and there are few attendant care services in their community. I almost ended up in a shelter – I don’t ever want to be in that position again. I don’t even know if there are any wheelchair-accessible shelters.”
Does Greg miss working?
“Yes. I was good at my job. I took pride in my work and I liked having contact with people every day. I liked customer service the best.” And the part of his job he found most stressful? “Getting there! My jobs were not that stressful – but getting to work was. Attendants were constantly late or did not show up for my morning shifts. It was hard getting care before 7 a.m. so I could get to work on time. I started most jobs by 8 a.m. Also, there was the Wheel-Trans nightmare. Half the time they were late getting me to work. Sometimes they would [say I didn’t show up] because my attendant started late and I was not ready on time. And then there was the after-work wait every day trying to get home. Taking a taxi meant paying close to a day’s wages just to get to and from work. It wasn’t worth the hassle and it really affected my health.”
It appears that the biggest barriers to getting employment, however precarious it may be, are factors such as the inflexibility of moving between income security programs and job income; inadequacy of transportation; and attendant scheduling. These factors partially explain why being in the labour force is such a minefield for people with disabilities.
Not surprisingly, low literacy levels appear to have an impact on workplace participation and the types of jobs people can do. Consider the Winklers’ story. A baker and a hairdresser by trade, the Winklers were illiterate in all three languages they used to communicate. After emigrating and having three children, the Winklers decided they wanted to become citizens. They were pretty sure that with citizenship, they would be able to receive higher wages from employers. To get citizenship, however, they needed to prove their literacy by signing their names. After months of tutoring by their children, Mrs. Winkler knew the letters of her name; Mr. Winkler did not. She could sign; he could not, and that changed how they would live and work for the rest of their lives.

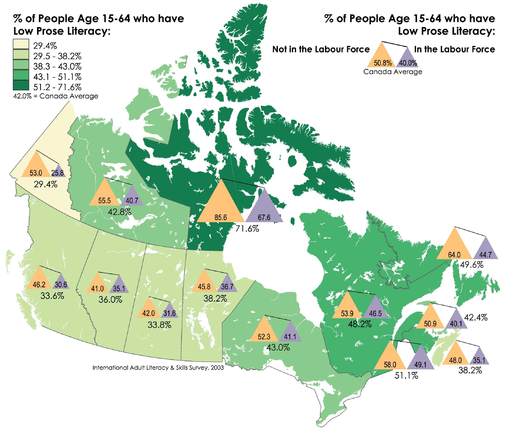
The map above (Map II) paints an image of what labour force participation numbers look like for people who have low “prose” literacy. Researchers at York University, the University at Buffalo and the Canadian Abilities Foundation used literacy data from the Canadian component of the International Adult Literacy and Skills Survey (IALSS) 20031 to create this map.
As a starting point, this data tells us something about differences in rates of low literacy across Canada. Slightly more than half of people (aged 15 – 64) who scored low on the “prose literacy” portion of the IALSS were not in the labour force. In other words, Map II shows that if someone has a low prose literacy test score, they are less likely to have paid employment. Map II also shows four provinces/territories that have a higher number of people (compared to the Canadian average) who struggle with literacy, regardless of whether they are in or out of the labour force: Nunavut, Newfoundland and Labrador, Quebec and New Brunswick.
The next step for our research team is to look at links between disability, literacy and employment participation. The maps help us pinpoint places to start looking for these links. For instance, data shows that all of the provinces listed above have higher-than-average rates of low prose literacy and higher rates of labour force non-participation for people with disabilities. Further research will help to clarify what this means.
For now, when we think of Greg’s experience together with that of the Winklers, the parameters of discrimination become clearer. The numbers bear witness to the human stories, while the maps reveal potential places to look for links amongst literacy, disability and employment participation rates.
_________________________________________________________________
1 The data presented here are about “prose” literacy. The IALSS breaks literacy down into four components: prose, numeracy, problem-solving and document.


